Weekly Usage Report — Week 4 (Apr 27–May 3): 495 Million Accounted Tokens for £9.24
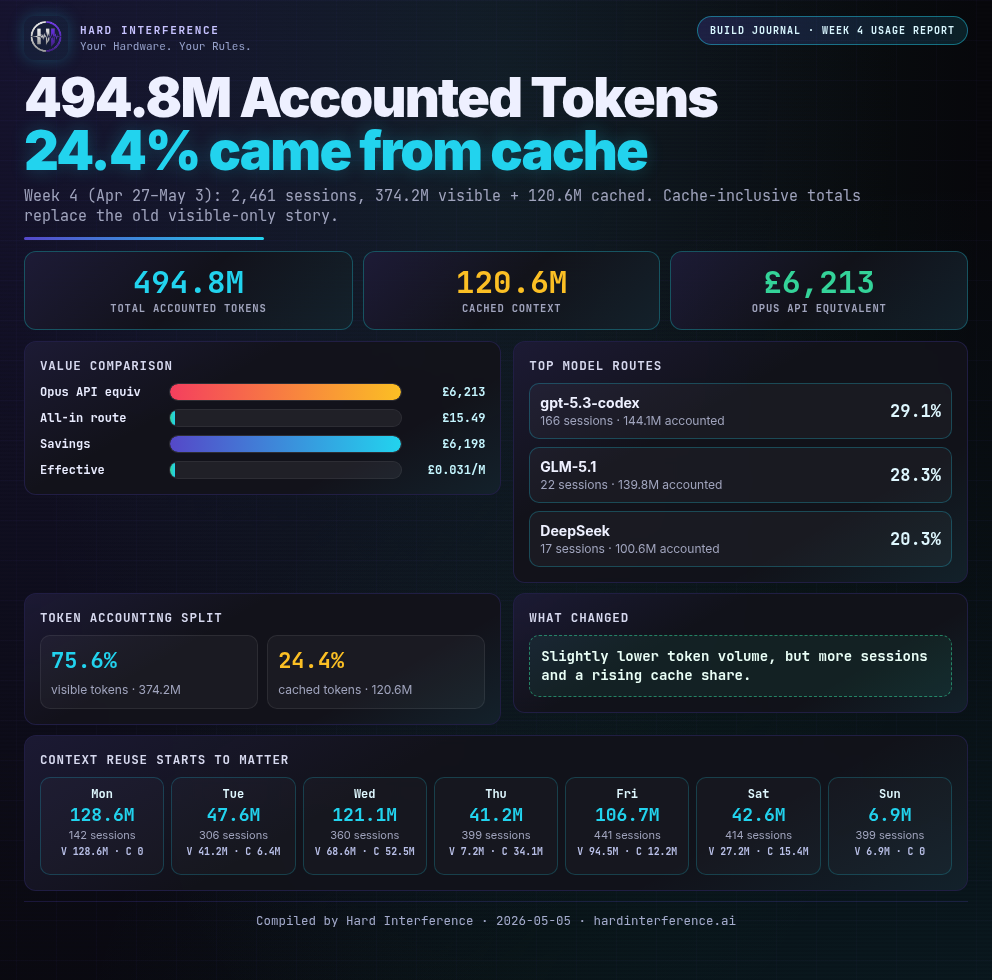
Week 4: 374.2M visible tokens plus 120.6M cached tokens, for 494.8M total accounted Hermes tokens across 2,461 sessions. Opus-equivalent API cost: about £6,213.
Weekly AI Usage Report — Week 4: When Usage Patterns Shift
Token accounting
This report separates visible prompt/completion tokens from cached context. Visible tokens show fresh input/output work; cached tokens show repeated context reused during long agent sessions. Together, they show the full model-traffic footprint for the week.
- Visible tokens (input + output): 374,173,313 (374.2M)
- Cached tokens (cache-read/write): 120,588,416 (120.6M)
- Total accounted tokens: 494,761,729 (494.8M)
- Sessions: 2,461
- Input tokens: 368,417,346
- Output tokens: 5,755,967
- Total cost: £9.24/week
- Opus-equivalent API cost: approximately £6,213
Reporting period: Monday 27 April – Sunday 3 May 2026 Previous week (Week 3): 449.3M tokens, 2,288 sessions, £9.24/week
The headline numbers
Week 4 was never going to match Week 3's raw volume. That was the week I was rebuilding everything from scratch — cron jobs, toolchains, the whole Hermes stack. Week 4 was different. It was the week the usage pattern changed.
- Sessions: 2,461 (up 7.6% from 2,288)
- Visible tokens (input + output): 374,173,313 (374.2M, down 16.7% from 449.3M)
- Input tokens: 368,417,346
- Output tokens: 5,755,967
- Average tokens per session: 152,041
- I/O ratio: approximately 64:1 (down from 117:1 in Week 3)
- Subscription cost: £9.24/week (pre-Pro upgrade)
- Effective rate: approximately £0.019 per million accounted tokens
On the surface, fewer tokens might look like regression. It isn't. The I/O ratio halving tells the real story: more interactive work, more output-heavy sessions, more mixed-mode operation rather than just shoving massive context windows at the model and asking for one thing.
The week in one picture
This is the headline version of Week 4: 374.2M tokens, 2,461 sessions, £9.24 in subscription route cost — and the bottleneck shifting from invoices to daily usage limits.
By model: the visible-route workhorses shift
The model mix tells you what kind of week it was. These route figures describe visible input/output tokens only; the 120.6M cached-context tokens are included in the weekly accounted total above, but are not allocated cleanly by model route here.
- GLM-5.1: 204.2M visible tokens, 319 sessions, about 54.6% of visible route tokens. This combines the raw
GLM-5.1andGLM-5.1 cloudlabels, because they are the same model surfaced through different route names. It was still the heavy lifter for the week: deep reasoning, complex agentic loops, and a lot of quick cloud-routed sessions under one model family. - DeepSeek V4 Pro: 98.6M visible tokens, 17 sessions, about 26.3% of visible route tokens. A serious heavy-lift model this week — low session count, huge context volume, the kind of pattern you see when the agent is chewing through real build work.
- GPT-5.3 Codex: 46.5M visible tokens, 166 sessions, about 12.4% of visible route tokens. The coding specialist. Appeared more as the week went on — a signal that app and game development work was ramping up.
- Qwen 3.5 9B local: 15.0M visible tokens, 1,930 sessions, about 4.0% of visible route tokens. This is the sleeper hit. Nearly 2,000 sessions on a tiny 9-billion-parameter local model. That's quick lookups, light reasoning, and cron automation — the stuff you don't think about but rely on constantly.
- GPT-5.5: 6.5M visible tokens, 14 sessions, about 1.7% of visible route tokens. Strategic use only — when the answer genuinely needs the biggest brain.
- DeepSeek V4 Pro cloud: 2.0M visible tokens, 11 sessions. Occasional overflow.
- Nemotron 3 Super: 1.3M visible tokens, 1 session. One deep dive.
The Qwen 3.5 stat is worth a second look. 1,930 sessions at 15M visible tokens works out to under 8,000 visible tokens per session. That's the pattern of a utility model — fire and forget, low latency, no cost anxiety. Most people don't think about the small models, but they handle the bulk of daily interactions.
By source: the CLI takeover
- CLI: 106 sessions, 205.6M visible tokens — 55% of visible source-token volume from just 4.3% of sessions
- Telegram: 21 sessions, 131.8M visible tokens — the second-heaviest visible source despite low session count
- Cron: 2,334 sessions, 36.7M visible tokens — 95% of all sessions, but mostly lightweight automated tasks
The CLI number is the story here. 106 sessions accounting for over half the visible source-token volume. These are long, focused work sessions — development, debugging, architecture planning. When I'm in the terminal working on something, the token burn rate is completely different from quick Telegram queries or cron-driven automation.
Telegram's 21 sessions at 131.8M visible tokens reflects heavy mobile-accessible sessions — checking in, running reports, managing the system from outside the home network.
Cron sessions are the long tail: 2,334 automated jobs averaging about 15,700 visible tokens each. Monitoring, scheduled tasks, routine checks. The infrastructure layer you don't think about until it stops working.
Daily breakdown: a week of contrast
- Mon Apr 27: 142 sessions, 128,555,210 visible (128.6M) + 0 cached (0.0M) = 128,555,210 total accounted tokens (128.6M), 26.0% of the week; cache share 0.0%, visible share 100.0%. Work note: Peak volume day. A deep work Monday that set the tone.
- Tue Apr 28: 306 sessions, 41,202,187 visible (41.2M) + 6,420,480 cached (6.4M) = 47,622,667 total accounted tokens (47.6M), 9.6% of the week; cache share 13.5%, visible share 86.5%. Work note: Session count doubles, volume drops. More context switching, less deep focus.
- Wed Apr 29: 360 sessions, 68,635,107 visible (68.6M) + 52,477,952 cached (52.5M) = 121,113,059 total accounted tokens (121.1M), 24.5% of the week; cache share 43.3%, visible share 56.7%. Work note: Recovering rhythm. Mixed depth.
- Thu Apr 30: 399 sessions, 7,154,444 visible (7.2M) + 34,062,848 cached (34.1M) = 41,217,292 total accounted tokens (41.2M), 8.3% of the week; cache share 82.6%, visible share 17.4%. Work note: The outlier. Nearly 400 sessions but barely any token volume — payroll day for the nursery business, so the agent work shifted into lightweight checks, admin support, and quick lookups rather than deep build sessions.
- Fri May 1: 441 sessions, 94,529,676 visible (94.5M) + 12,184,192 cached (12.2M) = 106,713,868 total accounted tokens (106.7M), 21.6% of the week; cache share 11.4%, visible share 88.6%. Work note: Peak session day. Heavy work going into the weekend.
- Sat May 2: 414 sessions, 27,196,688 visible (27.2M) + 15,442,944 cached (15.4M) = 42,639,632 total accounted tokens (42.6M), 8.6% of the week; cache share 36.2%, visible share 63.8%. Work note: Maintenance and exploration.
- Sun May 3: 399 sessions, 6,900,001 visible (6.9M) + 0 cached (0.0M) = 6,900,001 total accounted tokens (6.9M), 1.4% of the week; cache share 0.0%, visible share 100.0%. Work note: Another lightweight day. Light usage pattern suggesting prep for the week ahead.
Cost comparison: the flat-rate flex
Same token volume through API billing would have looked like this:
- Claude Opus 4.6 API: approximately £4,513.60 — roughly 488x the subscription cost
- Gemini 2.5 Pro API: approximately £1,022.65 — roughly 111x
- Claude Sonnet API: approximately £902.72 — roughly 98x
- GPT-5.3 Codex API: approximately £444.82 — roughly 48x
- DeepSeek Chat API: approximately £80.15 — roughly 8.7x
- GPT-4o mini API: approximately £44.48 — roughly 4.8x
These are estimates, not invoices, but the direction is unambiguous. At these volumes, flat-rate subscription pricing is transformative. Even compared to the cheapest API alternatives, the subscription cost is under a fifth of what you'd pay on consumption billing.
The practical effect: when the marginal cost of a query is zero, you stop thinking about whether a question is "worth" asking. You ask. And that changes how you work.
Week over week: what changed
- Tokens: 449.3M → 374.2M, down about 16.7%
- Sessions: 2,288 → 2,461, up about 7.6%
- Effective rate: £0.017/M → £0.019/M on accounted tokens — still basically pocket change per million tokens
- I/O ratio: 117:1 → 64:1 — nearly halved, reflecting more interactive and output-heavy work
Week 3 was raw scale — the build-out, the setup, the restoration of the Hermes environment from scratch. Week 4 was something else: operational maturity. More sessions, less total volume, but the work was more mixed and more deliberate. The CLI became the primary interface. Cron automation handled the background hum.
The drop in I/O ratio is the most interesting metric. 117:1 in Week 3 meant I was feeding the model enormous context windows — reading entire codebases, full configuration files, complete logs. 64:1 in Week 4 means the model was writing more, interacting more, generating more output. The conversations got more symmetrical.
The post-week development: Pro upgrade
Note: On Monday 4 May, after the reporting week ended, I upgraded ChatGPT to Pro at £89/month.
The reason was straightforward: I was hitting daily limits regularly. When you're running hundreds of sessions a day and doing app and game development on the side, the Plus-level limits become a bottleneck faster than you'd expect.
This is the operational insight that Week 4 crystallised: when the subscription covers the cost but the daily cap doesn't cover the volume, the constraint shifts from money to limits. Hitting a daily rate limit is more frustrating than a bill — it stops you mid-flow.
The Pro upgrade wasn't about wanting more features. It was about removing a throttle. When the ceiling becomes usage limits rather than invoices, you start managing AI like infrastructure rather than a utility.
The builder's takeaway
Week 4 taught me something I didn't expect to learn this early in the experiment.
Flat-rate AI subscriptions don't just change your cost structure. They change your behaviour. When every query costs the same as every other query, you optimise for throughput and quality, not for frugality. You run 2,461 sessions in a week not because you're trying to justify the subscription, but because the work demands it.
The effective rate of about £0.019 per million accounted tokens — under 2 pence per million tokens — means the subscription is already paid for by the first few serious sessions of the week. Everything after that is gravy.
If you're a builder running your own infrastructure and you're still on consumption-based AI billing, do the maths on your actual volume. The breakeven point on flat-rate subscriptions is lower than most people think. And the behavioural upside — not having to think twice about asking — is something spreadsheets don't capture.
Found this useful? 👉 Follow @Raf_VRS for more transparent AI insights that put you in control of your hardware. 👉 Support the work: ko-fi.com/rafvrs
#VRSComputing #ModelBenchmarking #TokenUsage #AIAgents #CostTransparency