Weekly Usage Report — Week 5 (May 4–10): 731 Million Accounted Tokens for £20.54
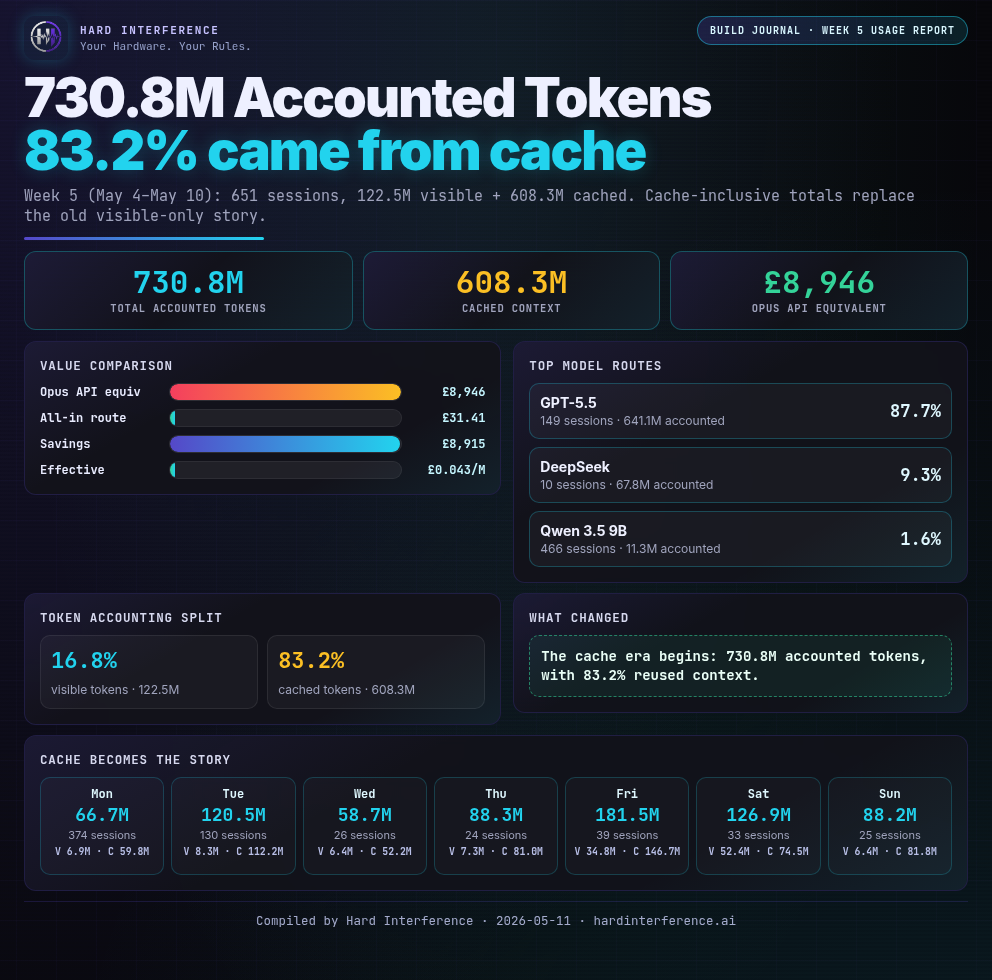
Week 5: 122.5M visible tokens plus 608.3M cached tokens, for 730.8M total accounted Hermes tokens across 651 sessions.
Weekly AI Usage Report — Week 5: The Usage Moved Windows
Reporting period: Monday 4 May – Sunday 10 May 2026
Previous week (Week 4): 494.8M total accounted tokens, 2,461 sessions, £9.24/week
Subscription context: ChatGPT Pro at £89/month.
Token accounting
This report separates visible prompt/completion tokens from cached context. Visible tokens show fresh input/output work; cached tokens show repeated context reused during long agent sessions. Together, they show the full model-traffic footprint for the week.
- Visible tokens (input + output): 122,524,629 (122.5M)
- Cached tokens (cache-read/write): 608,323,850 (608.3M)
- Total accounted tokens: 730,848,479 (730.8M)
- Sessions: 651
- Input tokens: 118,865,929
- Output tokens: 3,658,700
- ChatGPT Pro weekly cost equivalent: £20.54/week
- Opus-equivalent API cost: approximately £8,946
This is the first weekly report where visible input/output tokens badly understate the real footprint. Hermes logged 122.5M visible tokens across 651 sessions, but cached context added another 608.3M tokens, taking the audited total to 730.8M accounted tokens.
The week in one picture
This is the headline version of Week 5: 122.5M visible tokens, 608.3M cached tokens, and 730.8M total accounted Hermes tokens. The local database is now split into visible and cached context instead of being reduced to one misleading headline number.
Top visible model routes
- DeepSeek V4 Flash: 67.8M visible tokens, about 55.3% of visible route tokens. Ten very large-context sessions doing the heavy local chewing.
- GPT-5.5 here: 33.8M visible tokens, about 27.6% of visible route tokens. This was the judgement layer: final design guardrails and blog proofreading.
- Qwen 3.5 9B local: 11.3M visible tokens, about 9.2% of visible route tokens. Still the utility worker for quick checks and background automation.
- Other Hermes routes: about 9.6M visible tokens, about 7.8% of visible route tokens, covering Qwen Coder, GLM-5.1, Gemma, and tiny specialist calls.
The route percentages above describe the 122.5M visible input/output tokens only. The bigger Week 5 story is that cached context became the largest part of the full 730.8M accounted-token footprint.
Daily breakdown
- Mon May 4: 374 sessions, 6,919,838 visible (6.9M) + 59,810,304 cached (59.8M) = 66,730,142 total accounted tokens (66.7M), 9.1% of the week; cache share 89.6%, visible share 10.4%. Work note: Lots of lightweight activity after the Pro upgrade, but not much heavy context.
- Tue May 5: 130 sessions, 8,309,196 visible (8.3M) + 112,152,015 cached (112.2M) = 120,461,211 total accounted tokens (120.5M), 16.5% of the week; cache share 93.1%, visible share 6.9%. Work note: Operational checks, edits, and fragmented follow-through.
- Wed May 6: 26 sessions, 6,442,509 visible (6.4M) + 52,232,507 cached (52.2M) = 58,675,016 total accounted tokens (58.7M), 8.0% of the week; cache share 89.0%, visible share 11.0%. Work note: Lower session count, steadier work.
- Thu May 7: 24 sessions, 7,271,481 visible (7.3M) + 81,041,408 cached (81.0M) = 88,312,889 total accounted tokens (88.3M), 12.1% of the week; cache share 91.8%, visible share 8.2%. Work note: Controlled local usage while more work shifted outside Hermes.
- Fri May 8: 39 sessions, 34,788,109 visible (34.8M) + 146,733,568 cached (146.7M) = 181,521,677 total accounted tokens (181.5M), 24.8% of the week; cache share 80.8%, visible share 19.2%. Work note: The first heavy local spike.
- Sat May 9: 33 sessions, 52,372,614 visible (52.4M) + 74,546,176 cached (74.5M) = 126,918,790 total accounted tokens (126.9M), 17.4% of the week; cache share 58.7%, visible share 41.3%. Work note: The biggest Hermes-tracked day of the week.
- Sun May 10: 25 sessions, 6,420,882 visible (6.4M) + 81,807,872 cached (81.8M) = 88,228,754 total accounted tokens (88.2M), 12.1% of the week; cache share 92.7%, visible share 7.3%. Work note: Cooldown, review, and wrap-up.
What actually happened this week
Most of the time here went into guardrailing final designs and proofreading the blog. That is not glamorous work, but it is the difference between "the agent made something" and "this is safe enough to show people".
That meant checking final layouts, catching inconsistent copy, tightening public-facing posts, and making sure the blog did not look like it had been assembled by seven over-caffeinated agents in a trench coat.
The Week 5 story is clear: the local machine was doing more repeated-context work than the visible prompt/completion number suggested. The cached context was the hidden mass.
The price comparison
Using the audited 730.8M total accounted token workload, the per-token comparison looks like this:
- Claude Opus 4.6 API: approximately £8,946 — about 436x the ChatGPT Pro weekly equivalent
- Gemini 2.5 Pro API: approximately £1,997 — about 97x
- Claude Sonnet API: approximately £1,764 — about 86x
- GPT-5.3 Codex API: approximately £868 — about 42x
- DeepSeek Chat API: approximately £156 — about 7.6x
- GPT-4o mini API: approximately £87 — about 4.2x
These are still estimates, not invoices. But the direction is clear enough: even with the higher Pro subscription cost, flat-rate usage is still absurdly cheaper at this workload level.
The difference this week is that the subscription meter, not the local database, became the better signal for part of the work.
Week-over-week comparison
- Visible tokens (input + output): 374.2M → 122.5M, down 67.3%
- Hermes sessions: 2,461 → 651, down 73.5%
- Effective subscription rate: £0.019/M in Week 4 → £0.028/M on accounted tokens in Week 5
- Constraint: Week 4 was about daily limits. Week 5 was about cache-heavy creative and publishing work.
So the wrong headline is "usage collapsed".
The right headline is "usage moved".
Week 4 was mostly readable through visible tokens. Week 5 showed why the reporting model had to catch cached context, not just prompt/completion text.
The stack
- ChatGPT Pro: £89/month, about £20.54/week.
- Hermes on Linux: local orchestration, design guardrails, proofreading, code/file verification, cron automation.
- Qwen 3.5 9B local: zero marginal cost utility model.
- Other cloud routes: used selectively where they fit the job.
No single dashboard sees all of this cleanly yet. That is fine, as long as the report says so plainly.
The bottom line
Week 5: 122.5M visible tokens, 608.3M cached tokens, 730.8M total accounted tokens, 651 Hermes sessions.
This is what happens when AI becomes part of the workshop rather than a single chat tab. Some work appears as fresh input/output. A lot of agent work reuses repeated context through cache. The report now shows both.
The operator lesson is simple: measure what you can, annotate what you cannot, and do not let a clean database tell a dirty lie.
Found this useful?
👉 Follow @Raf_VRS for more transparent AI insights that put you in control of your hardware.
👉 Support the work: ko-fi.com/rafvrs
#VRSComputing #ModelBenchmarking #TokenUsage #AIAgents #CostTransparency